Every MBA and CFA student will learn to work with distributions in their first statistics or quantitative analysis course. Many students struggle to
- Differentiate between probability density function (PDF) vs cumulative distribution function (CDF) when working on statistical problem sets.
- Wonder why the probability density function does not apply to continuous distributions but is relevant for discrete distributions.
We address the above questions on a probability density function (PDF) vs cumulative distribution function (CDF)
A distribution in statistics or probability is a description of the data. This description can be verbal, pictorial, in the form of an equation, or mathematically using specific parameters appropriate for different types of distributions. Statisticians have observed that frequently used data occur in familiar patterns and so have sort to understand and define them. Frequently seen patterns include the normal distribution, uniform distribution, binomial distribution, etc.
The Cumulative Distribution Function (CDF)
The cumulative distribution function (CDF) is the probability that a random variable, say X, will take a value equal to or less than x.
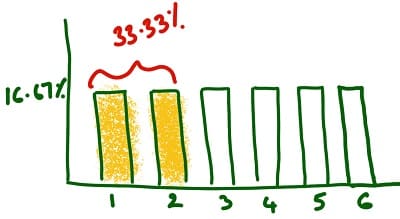
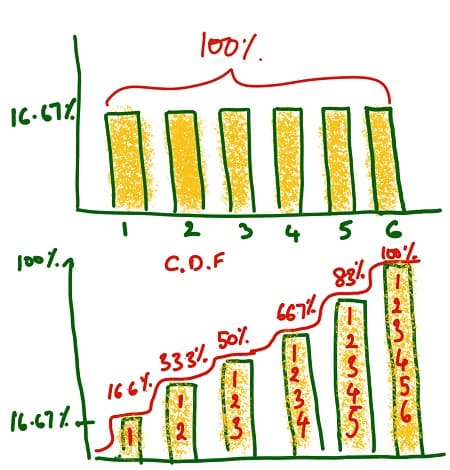
For example, if you roll a die, the probability of obtaining a 1 or 2 or 3 or 4 or 5 or 6 is 16.667% (=1/6) individually. The cumulative distribution function (CDF) of 1 is the probability that the next roll will take a value less than or equal to 1 and is 16.667%. There is only one possible way to get a 1. The cumulative distribution function (CDF) of 2 is the probability that the next roll will take a value less than or equal to 2. The cumulative distribution function (CDF) of 2 is 33.33% as there are two possible ways to get a 2 or below (the roll giving a 1 or 2).

The cumulative distribution function (CDF) of 6 is 100%. The cumulative distribution function (CDF) of 6 is the probability that the next roll will take a value less than or equal to 6 and is equal to 100% as all possible results will be less than or equal to 6.
Probability Density Function (PDF)
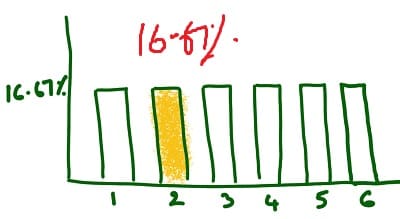
The probability density function (PDF) is the probability that a random variable, say X, will take a value exactly equal to x. Note the difference between the cumulative distribution function (CDF) and the probability density function (PDF) – Here the focus is on one specific value. Whereas, for the cumulative distribution function, we are interested in the probability of taking on a value equal to or less than the specified value. The probability density function is also referred to as the probability mass function. So do not get perturbed if you encounter the probability mass function.

For example, if you roll a die, the probability of obtaining 1, 2, 3, 4, 5, or 6 is 16.667% (=1/6). The probability density function (PDF) or the probability that you will get exactly 2 will be 16.667%. Whereas, the cumulative distribution function (CDF) of 2 is 33.33% as described above.
Probability Density Function (PDF) vs Cumulative Distribution Function (CDF)
The CDF is the probability that random variable values less than or equal to x whereas the PDF is a probability that a random variable, say X, will take a value exactly equal to x.

This page provides you with more details on when to use the related Norm.Dist and Norm.Inv Microsoft Excel functions?
Probability Mass Function vs Cumulative Distribution Function for Continuous Distributions and Discrete Distributions
We have seen above that the probability density function is relevant in the case of discrete distributions (roll of a dice). Why is the probability density function not relevant in the case of continuous distributions?
There is an infinite number of values between the min and max in the case of continuous distributions. Therefore, we can say that the probability of a specific value will be 1/infinity or practically zero! So we conclude that the probability density functions are not relevant in the case of continuous distributions.
Probability Density Function (PDF) vs Cumulative Distribution Function (CDF) in Microsoft Excel
You can work with probability questions now that you are clear on the concept of Probability Density Function and Cumulative Distribution Functions. When working with probability density in Microsoft Excel, you have to specify if you want the Probability Density Function (PDF) or the Cumulative Distribution Function (CDF).
For example, if you are working with the normal distribution, the syntax is NORM.DIST(x,mean,standard_dev,_____)
- The value of TRUE in the blank in the NORM.DIST Excel function indicates a Cumulative Distribution Function (CDF).
- The value of FALSE in the blank in the NORM.DIST Excel function indicates a Probability Density Function (PDF).
Probability Density Function (PDF) vs Cumulative Distribution Function (CDF) in R
The difference between the probability density function and the cumulative distribution function in R programming is captured by the prefixes ‘p’ and ‘d’.
R programming distributions have specified terms. For example, the normal distribution is annotated by ‘norm’ in R programming. So dnorm represents probability density function and pnorm gives you the cumulative distribution.
Let’s look at another example. The binomial distribution is denoted by binom in R programming. Therefore dbinom represents the probability density function and pbinom gives you the cumulative distribution.
If you wanted to know the probability of obtaining exactly 50 heads when tossing a coin 100 times, you are looking for the probability density function. So you would run dbinom(50, size=100, prob=0.5) and obtain 0.07958924. This represents a 7.96% chance of obtaining exactly 50 heads.
On the other hand, if you wanted to know the probability of obtaining 50 heads or fewer when tossing a coin 100 times, you are looking for the cumulative density function. So you would run pbinom(50, size=100, prob=0.5) and obtain 0.5398. This represents a 53.98% chance of obtaining 50 or fewer heads.
Graduate Level Tutoring on Distributions
We provide one on one tutoring for MBAs and CFAs on a variety of subjects including statistics. Call or email us if one of our statistics tutor can assist you with tutoring on probability density functions or cumulative distribution functions in R programing or Microsoft Excel or another statistical software you are working with.