What would happen to market prices and quantity sold or demanded if the supply of a product or service dropped suddenly? This article in the Washington Post says that honeybee supply dropped due to mysterious honeybee colony ‘die-offs’ called “colony collapse disorder” (noticed first around 2006). Can the economics concepts you learn in MBA economics explain what would be the impact on the honeybee market? How would the demand and supply curves change as a result of the supply shock? Would the prices and quantity sold go up or down?
Economics: Equilibrium, Demand and Supply
Among the first concepts MBA students encounter in microeconomics are the demand and supply curves. Students learn the various properties of demand and supply curves, factors driving the demand and supply curves and how they interact to produce the market equilibrium. This understanding is central to pretty much all the study of economics and policy.
The demand and supply curves are usually drawn on an X-Y graph with the quantity demanded or supplied on the X axis and the price on the Y axis. For normal goods the quantity demanded falls as the price rises and so the demand curve falls from the left to the right (which is a topic for another class). The supply ,on the other hand, increases as the price goes up and so increases as we move from the left to the right. The interaction between them results in the market equilibrium – which is the market price and quantity (a topic for another day).
The Factors Driving Demand and Supply
In economics, we usually depict the demand curve, supply curve and equilibrium on an X-Y graph with the quantity demanded or supplied on the X axis and the price on the Y axis. But we also admit that price is not the only factor that impacts demand and supply. A host of other factors impact demand and supply.

The factors that impact demand include income, price of substitutes, price of compliments, consumer tastes, population or consumer numbers, etc. The factors that impact supply include price of the product, price of inputs, price of related inputs/substitutes, available technology, etc.
Understanding the demand and supply curves requires understanding what happens to the demand and supply curves when various events occur such as changes in market conditions, technology, natural disasters, war, etc. These changes in demand and supply curves are broadly classified into two distinct categories or types:
- Moves along the demand or supply curve; and
- Shifts of a demand or supply curve.
Movement along the demand or supply curve vs Shift of a demand or supply curve.
The simplest way to understand the difference between movement and shift on the demand and supply curves is to understand these two rules.
You get a movement along the demand or supply curve, when all factors affecting demand and supply are constant and ONLY the PRICE changes.
With regards to a shift, the rule to remember is:
You get a shift of the demand or supply curve, when ANY ONE of the MANY FACTORS affecting demand and supply changes.
You may have a price change as a result of the shift but it is not the cause of the shift in this case .
Impact of Movement along and Shift of the Demand and Supply Curves
When there is a change in the demand or supply curves, you will have a change in the equilibrium price and quantity. Will you know the direction of change in the price and quantity of the new equilibrium position?
You can predict the direction of the change in price and quantity as a result of the change in the supply or demand curves ONLY if we have .
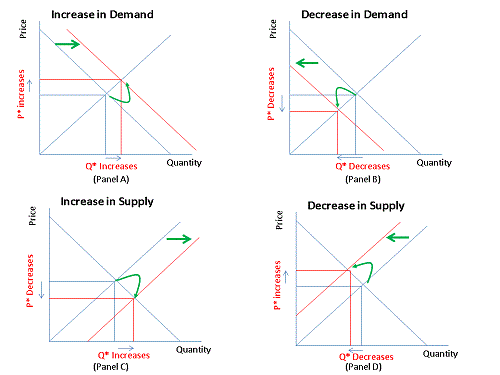
- Increase in demand > Demand shifts to the right > Price and Quantity increases (Panel A)
- Decrease in demand > Demand shifts to the left> Price and Quantity decreases (Panel B)
- Increase in supply> Supply shifts to the right > Price decreases and Quantity increases (Panel C)
- Increase in demand > Supply shifts to the left > Price increases and Quantity decreases (Panel D)

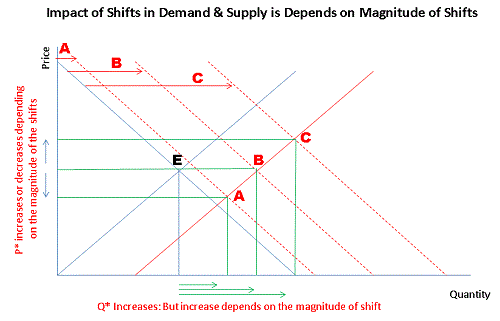
For example, if there is an increase in both demand and supply (curves shifts to the right), then the new equilibrium can either be at a point where:
- Price decreases but quantity increases (Point A)
- Price stays the same but quantity increases (Point B)
- Price increases and quantity increases (Point C)

See how Economics plays out in the real world
Now that you understand the difference between a shift of the supply curve and a move along the demand curve, can you explain the impact of the supply shock on honeybees outlined in this Washington Post article?
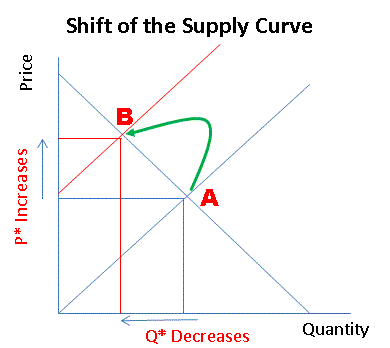
The article actually explains what happened to honeybee demand and supply curves and changes in equilibrium as a result of a supply shock. Honeybee supply dropped due to mysterious die-offs called “colony collapse disorder” to the extend of 20 to 40 percent of managed honeybee colonies each winter over the past decade (prior to 2006). This would indicate a shift of the supply curve to the left! What happened to prices:
The article says “The average retail price of honey has roughly doubled since 2006.”
It looks like the supply curve shifted to the left causing the price to move up.
Economic theory plays out in the real world. You should be able to predict what is coming before it happens so as the CEO or leader of your organization you can make your investment decisions or strategic moves ahead of the curve.
