Our MBA students, in their portfolio management classes, encounter one or more of the Capital Allocation Line (CAL), Capital Market Line (CML), Security Characteristics Line (SCL) and Security Market Line (SML). Often it becomes a challenge to understand the difference between these concepts. To help clarify, we have captured the essence of these lines and tried to highlight the differences between.
- Capital Allocation Line (CAL)
- Capital Market Line (CML)
- Security Characteristics Line (SCL)
- Security Market Line (SML)
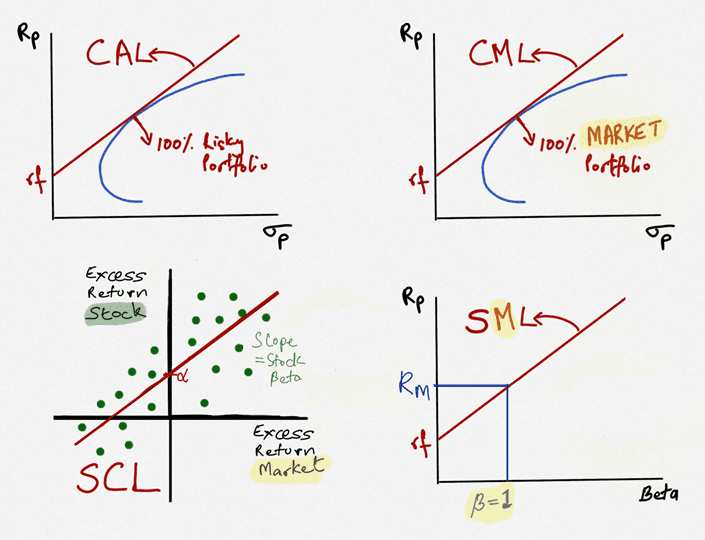
- Graph: Difference Between the CAL, CML, SCL & SML
- Summary Table: Difference Between the CAL, CML, SCL & SML with Intercept and Slopes
We first individually look at the Capital Allocation Line (CAL), Capital Market Line (CML), Security Characteristics Line (SCL) and Security Market Line (SML) and also summarize the differences between the CAL, CML, SCL & SML in a graph and table.
Capital Allocation Line (CAL)
You can invest in one or two stocks or a portfolio consisting of two or more stocks. However, the efficient frontier shows you the best combination of stocks that are most efficient, given your risk preference. Here, by most efficient, we mean the highest return for the given level of risk measured by standard deviation.
These efficient portfolios are not your only investment options. You can invest some portion of your money in a risk-free asset and the remaining in a portfolio of your choice (called a risky asset).
The capital allocation line (CAL) shows you all possible portfolios that can be created by combining a risk-free asset with a risky portfolio in different proportions. These proportions range from being fully invested in (100%) in risk-free assets on one end to being fully invested in the market or borrowing money and investing more than 100% of your worth in the market at the other end. The CAL shows the risk-return trade-off for various portfolios that combine risk-free assets and risky assets, such as a portfolio of risk-free assets, stocks, or bonds.
The capital allocation line (CAL) has risk or standard deviation on the X axis and expected returns on the Y axis. The intercept of the CAL is the risk-free rate, and the slope of the CAL is the Sharpe Ratio (Portfolio return – Risk-free rate) /Standard deviation) of the optimal portfolio on the efficient frontier.
Capital Market Line (CML)
The capital market line (CML) is a capital allocation line (CAL) with a difference. The CML has the market portfolio as the risky asset. You can invest some portion of your money in a risk-free asset and the remaining in the optimal market portfolio (a risky asset). The capital market line (CML) shows you all the optimal portfolios that can be created by combining a risk-free asset with ONE specific market portfolio (optimal market portfolio) in different proportions.
The capital market line (CML) has risk or standard deviation on the X axis and expected returns on the Y axis. The intercept of the CML is the risk-free rate, and the slope of the CML is the Sharpe Ratio (Portfolio return – Risk-free rate) /Standard deviation) of the optimal market portfolio on the efficient frontier.
The CML shows the risk-return trade-off for various portfolios that combine risk-free assets and the market portfolio.
Security Characteristics Line (SCL)
The security characteristics line (SCL) graphs the stocks return in relation to the market’s return. In other words, it reflects unique or unsystematic risk of various marketable securities.
The security characteristics line (SCL) has the market’s excess returns (market return minus risk-free rate) on the X axis and a stock’s excess returns (stock’s expected return minus risk-free rate) on the Y axis. The intercept of the SCL is the alpha, and the slope of the SCL is the stock’s beta.
The security characteristics line (SCL) helps you view how risky a stock is in comparison to the overall market. A steep slope indicates that the stock has more risk relative to the market (slope greater than one). Conversely, a slope less than one (flatter or less than a 45-degree angle) indicates that the stock has less risk/volatility compared to the market.
Security Market Line (SML)
The security market line (SML) is a graphical presentation of the capital asset pricing model (CAPM). The CAPM provides the expected return on a stock considering its risk relation in relation to the market. In other words, it reflects various marketable securities’ systematic or market risk.
The security market line (SML) has risk measured by Beta on the X axis and expected return on the Y axis. The intercept of the SML is the risk-free rate, and the slope of the SML is the market risk premium.
The security market line helps you identify undervalued stocks. Undervalued stocks will generally lie above the security market line.
Difference Between the CAL, CML, SCL & SML: Graph
Sometimes it is easier to compare the difference between the CAL, CML, SCL & SML in a graph.
Intercept & Slope Difference Between the CAL, CML, SCL & SML: Summary Table
Here is a table that highlights the difference between the Capital Allocation Line (CAL), Capital Market Line (CML), Security Characteristics Line (SCL) and the Security Market Line (SML).
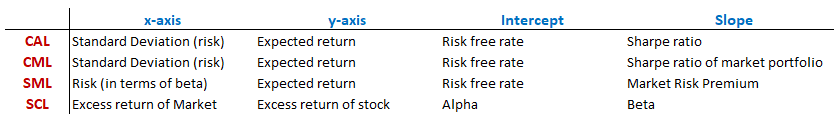
Note what the intercept and slopes of the Capital Allocation Line (CAL), Capital Market Line (CML), Security Characteristics Line (SCL) and the Security Market Line (SML) stand for. Also note where you find undervalued and overvalued stocks. This is a commonly seen finance quiz or portfolio exam question.
Please email or call us if we can assist you with finance tutoring or want to understand portfolio management better.