If you were asked how much money you made and how much money you spent in the last year, what would your response be?
If I were to pose the equivalent question to a company, I might be given the income statement as an answer.
I should be able to answer the following questions after I review the income statement of a company:
- What are the revenues of the company during the period?
- Have the revenues increased or decreased over the last two years?
- What are the various components of cost?
- How profitable was the company during this period?
- What are the earnings attributable to a share or the Earnings Per Share?
The income statement may be referred to by other names, including the statement of income or statement of operations. But it essentially highlights the revenues the company earned over a period and the expenses incurred to generate that revenue.
You must note three things before you dive into an income statement. First, note the time period the income statement covers. It could be a year, a quarter, or another time period. Income statements show the revenues, expenses, and profits over a specific period, usually a year or a quarter. Second, pay attention to the unit of measurement used. The units could be units, thousands, or millions. And third, the currency used. US companies report in dollars, but international firms report in their respective currencies.
When we look at Apple’s financial statements, we see that the income statement indicates “three years ended September 24, 2011”. Apple’s financial statement provides income statements for three years – 2009, 2010, and 2011 each covering a year of activity.
How Profitable is the Company?
I look at the income statement to understand how profitable the company is. The income statement tells me the value of the goods and services the company was able to earn servicing its customers over a specific period. This amount is reflected as revenues each year. The income statement also shows the various expenses or costs incurred to generate the revenues during this period. These expenses are recorded under various categories or heads. The expenses are set off against or subtracted from the revenues to indicate the profit or net income of the business.
Revenues – Expenses = Net Income (Profits)
If the net income is positive, we say the company has made a profit and is profitable. If the net income is negative, it is referred to as a loss, and we say that the company has not been profitable during the period. The income statement helps me understand if the business can provide goods and services at a cost lower than the price it can charge its customers.
To illustrate this, let’s look at Apple’s 2011 Income Statement. We can see that Apple was able to generate revenues of $108.2 billion. In other words, Apple provided its customers’ goods and services worth $108.2 billion. Apple incurred expenses of $82.3 billion to generate this revenue leaving Apple a net income or profit of $25.9 billion.
To make this more meaningful, I can look at expenses as a percentage of revenues. I can see that the expenses are 76% of revenues. The net income is 24% of revenues and is commonly referred to as the net profit margin. It indicates that for every dollar of revenues Apple makes, it earns 24 cents as profit. How does this compare to Google, Dell, Wal-Mart, or American Airlines? Which of these companies are profitable? Some of these companies have more expenses than revenues resulting in a net loss instead of a net income.
Components Of The Income Statement
Revenues
The first line I look at in an income statement is the revenues generated in the specified period. I also look to see if the revenues have increased or decreased over time.
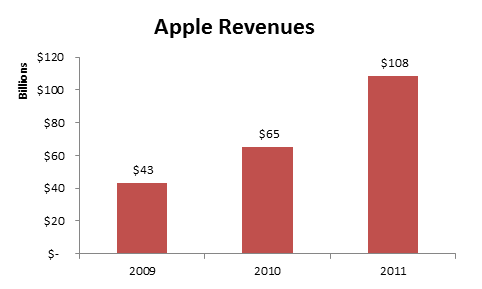
For example, when I look at the income statement of Apple, Inc., I can see that the revenue for the year ended on September 24, 2011 is $108 billion. I also see that the revenue has increased over the previous years. How does Apple’s revenue compare to the revenues of Google, Walmart, and American Airlines? Which of these companies is the largest in terms of revenue, and which is growing fastest?
Many income statements also provide a breakup of the different types of revenues. For example, Google provides a breakup of its revenues as revenues from advertising on its own properties, advertising from network properties, and other fees. Some companies also report gross revenues and net revenues. Gross revenues are revenues the company has made during the year. However, a company can expect non-paying customers, cancellations, and refunds, and these are subtracted from the gross revenues to arrive at the net revenues.
Cost Of Sales & Gross Margin
The next line I look at is the cost of sales. It is also referred to as the cost of goods sold and indicates the direct costs involved in providing the services or manufacturing the goods that provided the revenues. The cost of goods sold includes the direct costs incurred to provide the product or service, such as cost of raw material, salaries, wages, etc.
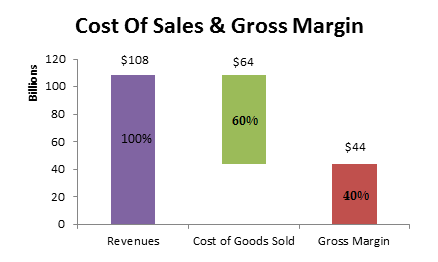
In 2011, we see that it cost Apple $64 billion in direct expenses (cost of goods sold) to produce $108 billion in sales.
Gross margin is arrived at by subtracting the cost of sales from revenues. This figure indicates how much money is left over after the cost of sales to cover other operating expenses such as marketing, distribution, administration, and corporate expenses.
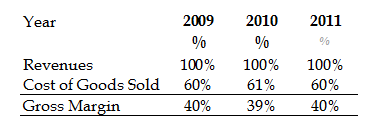
Dividing the gross margin by the revenues gives me the gross profit margin in percentage terms. I review what this number has been over a few years to see if it will give me any insight into the business. An increasing or steady gross profit margin is a good sign, whereas a declining gross profit margin should get me concerned.
I can see that Apple has maintained a steady gross profit margin over the last few years.
What do you notice about the gross profit margins of Google, Walmart, or American Airlines? Which of these companies has been able to maintain a steady gross profit margin? Has the change been for better or worse?
Operating Expenses
The cost of sales and gross margin are typically followed by other operating expenses. This includes research and development, selling expenses, marketing costs, commissions, royalties and fees, and any other operating expenses incurred during this period in the normal course of business. Operating expenses are slightly different from the cost of sales expenses because they are usually incurred over the period and not directly linked to the production of goods or services.
Apple’s financial statements show that it spent $2.4 billion on research and development and $7.6 billion on selling and general expenses in 2011. The amount of money spent by a company on the different types of operating expenses will depend on the nature of their business. For example, Apple is in the technology arena and must invest significantly in research and development. In contrast, Wal-Mart, a retailer, may not invest significantly in research and development.
Operating Income
I subtract the operating expenses from the gross margin to arrive at the operating income. The operating income indicates the profits generated from the core activities of the business. This is a number I would pay attention to because it represents the value the company is generating from its core business. I would also be interested to see what this number has been as a percentage of revenue over the last few years. This will help me notice any trends in profitability in the business.
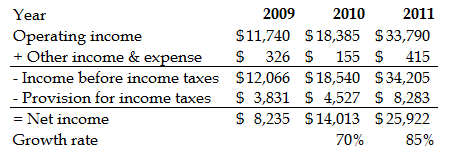
Apple’s operating income in dollars and its operating income as a percentage of revenues over the last three years has been increasing significantly. This indicates a very profitable business.
What do you notice about the operating income in dollars and its operating income as a percentage of revenues of Google, Wal-Mart, or American Airlines?
Other Income and Expenses
After the operating income and expenses have been reviewed, I will review the other income and expenses of a business. Often businesses have acquired investments that produce sizable revenues. Most companies borrow money and will pay interest on the money borrowed. The interest costs incurred will be reflected in this section of the balance sheet. Sometimes other expenses that have been incurred by the company will reduce the overall profitability of the company.
Apple has a lot of cash on its balance sheet and relatively little debt. Therefore, Apple has other income to report and no interest expenses to report. What other income and expenses do you notice in the income statements of Google, Wal-Mart, and American Airlines?
Net Income and Income Taxes
Subtracting the other income and expenses from the operating income of the business will give you the profit before taxes. Uncle Sam collects his share of the profits at this point. Taxes collected are used to run the government and provide public infrastructure to the nation. The computation of income taxes is a more complex process and one that we will not address at this level.
Subtracting the provision for income taxes from the profit before taxes gives you the net income of the business. This is the amount the business has generated during the period for its shareholders.
Apple’s net income has been increasing dramatically, with growth rates of 70% and 80%. Can we say the same about Google, Wal-Mart, or American Airlines? You can also look at the net income as a percentage of revenues to see the business’s profitability. We will examine that when we study percentage statements.
Earnings Per Share and Dividend
We saw in the earlier section that Apple generated $25.9 billion in net income for its shareholders in 2011. This belongs to all the shareholders together. Dividing the net income by the number of shares outstanding, which is 924,258, will give you the portion of net income that belongs to a shareholder who owes only one share of Apple. This is referred to as the Earnings Per Share (EPS).
Often companies also have another line here indicating ‘Diluted EPS,’ which is arrived at by dividing the net income by the outstanding shares and options or share warrants issued. This is the earnings for each share, assuming all warrants are converted into shares. We will not address this topic at this level.
The earnings per share is only the amount of net income attributable to each share outstanding in the company. The company can decide to retain this income so it can be re-invested back in the business or pay it out to shareholders. The amount paid to the shareholders is called the dividend.
How much in dividends did Apple payout in 2011? It did not pay out a dividend in 2010. On the other hand, Wal-Mart pays out dividends every quarter. What do you notice in the income statements of Google and American Airlines?
An important aspect to note about the income statement is that the amounts reflected are what the company earned or incurred. It is not the amount of money collected or actually paid. This information is usually derived from the cash flow statements.
Understanding Income Statements: Summary
The income statement summarizes the performance of a company for a specified period. The income statement tells you the revenue generated from goods or services provided and the expenses incurred to generate that revenue.
If I could only take away three facts from an income statement, I would look at:
- the revenues generated by the firm (so I know the size of the business);
- the profit margin (so I know the percentage of revenues that was left over for its shareholders after expenses); and
- Earnings per share (so I know the portion of the earnings I will be entitled to if I owned one share)
If you have questions or need help with figuring out an income statement, feel free to call our accounting or finance teams, and we will be happy to assist you.
Next Steps: Now that you have a good understanding of what is in an income statement and how to read an income statement in a company’s annual report, why don’t you head over to either:
- Learn how to read a balance sheet; or
- Learn how to read a cash flow statement; or
- Learn how to understand and interpret percentage statements.
If you are looking to build or model financial statements in Microsoft Excel, look no further than our collection of books here.
- Modeling Projected Financial Statements (Without a Plug!);
- Modeling Leveraged Buyouts – Simplified!;
- The ABCs of DCF Valuation and Modeling;
- 101 Private Equity & Investment Banking Interview Questions & Answers.
If you have questions or need help with figuring out an income statement, feel free to call our accounting or finance teams, and we will be happy to assist you.


